Most of us use Excel for analysing our data or to visulaise and modify it. Pivot table is one of the great features in Excel (if you know how to use it to the fullest; I am still learning it).
So, my usage includes grouping of data at different levels or sub-levels. For example, I have a table containing abundance of organisms at species level and I want abundance of phyla; then, I will add table in Pivot table and select only Phylum to change the view. It will automatically add abundance of all taxa belonging to same phylum.
However, I need to select/drag-&-drop each sample to values column. While it is possible for few samples, imagine the work load for 100 samples or even more (I have handled up to 600 samples). So, I searched for a way to add all of this samples at once.
I found a VB script for Excel (YES!!, you can do scripting in Excel).
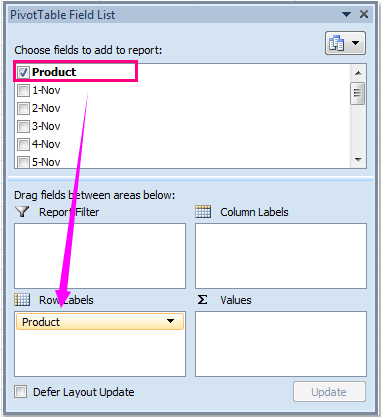
1. After creating the pivot table, firstly, you should add the row label fields as your need, and leaving the value fields in the Choose fields to add to report list, see screenshot:< /p>
2. Hold down the ALT + F11 keys to open the Microsoft Visual Basic for Applications window.
3. Click Insert > Module, and paste the following code in the Module Window.
VBA code: Add multiple fields into Value area of pivot tables in active worksheet
Sub AddAllFieldsValues()
Dim pt As PivotTable
Dim I As Long
For Each pt In ActiveSheet.PivotTables
For I = 1 To pt.PivotFields.Count
With pt.PivotFields(I)
If .Orientation = 0 Then .Orientation = xlDataField
End With
Next
Next
End Sub
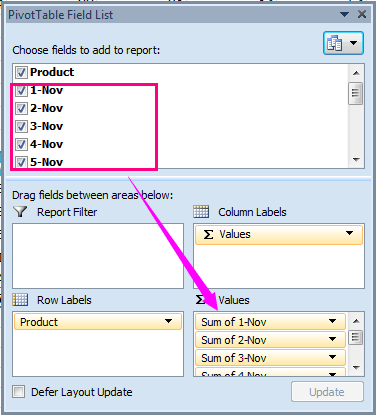
4. Then press F5 key to run this code, all the remaining fields have been added to the Values area at same time, see screenshot:
Note: This VBA code is applied to all pivot tables of active worksheet.
So, in this way I run the code and relax for a minute till it adds all samples for me.
Enjoy!!


